


-
 Business Decisions Backed by Industry-Leading Insights
Access information about a company’s overall creditworthiness before you extend credit, or view scores that incorporate fraud signals into the overall risk assessment. When you need to make critical business decisions our proven proprietary analytics can help you make them confidently.
It’s not just about crunching numbers—it's about transforming data into actionable insights that drive real business results. We can help you identify opportunities, optimize operations, control risk, ensure compliance, and build stronger customer relationships – all through the power of intelligent, data-driven analytics.
-
 People & Patents Are Our Superpower
Our data scientists and analysts apply the advanced statistical and modeling and leverage the collective knowledge of our extensive global data network. Go beyond surface-level insights and gain the deep understanding you need to make intelligent, data-driven business decisions.
Our AI-powered identity resolution process, with 231 granted and 136 published patents, helps ensure your teams are equipped with trusted, comprehensive company and contact records.
-
Enterprise Comprehensive Risk
-
Enterprise Credit Risk
-
Enterprise Supply Risk
-
Enterprise Key Indicators
The D&B Global Business Ranking provides a simple, globally consistent way to compare companies across countries on their relative risk of business failure with loss to creditors. GBR predicts predicts the likelihood that a company will become inoperable, inactive or dormant in the next 12 months. GBR provides actionable foresight on approximately 240 million active businesses worldwide, which is especially important amid times of global economic, political and environmental crisis. GBR offers opportunities to execute your global risk strategy, increase efficiencies, and drive profitable business decisions.
The GBR ranking is an alpha-numeric score, for instance 9C, where the number provides the overall rating and the letter indicates the depth of data available for this business' s ranking. Each business is ranked relative to all businesses in the D&B universe. GBR offers superior discriminant risk analysis, carving the global business universe into 15 segments with 1 representing lowest risk level and 15 – highest risk level.
| Predictive | Descriptive |
|---|---|
| GBR Rating (1-15 Scale) | Depth of data D&B has on the buisness (A-R classes) |
| 9 | C |
| GBR | Out of BusinessRate |
|---|---|
| 15 | 19.30% |
| 14 | 15.00% |
| 13 | 13.20% |
| 12 | 12.20% |
| 11 | 11.50% |
| 10 | 10.80% |
| 9 | 10.10% |
| 8 | 9.40% |
| 7 | 8.40% |
| 6 | 7.00% |
| 5 | 5.90% |
| 4 | 4.80% |
| 3 | 3.70% |
| 2 | 2.90% |
| 1 | 1.70% |
| DATA DEPTH | DESCRIPTION | MODEL SEGMENT | LEVEL OF INSIGHT |
|---|---|---|---|
| A | Financial with Trade | Financial and Trade | Robust Predictions |
| B | Financials Only | Financials Only | |
| C | Thick Trade Only | Trade Only | Robust Predictions |
| D | Thin Trade Only | Trade Only | Directional |
| E | Full Firmographics and Signals | Macro, Firmographic and Signal | |
| F | Full Firmographics without Signals or Partial Firmographics with/without Signals | Macro, Firmographic and Signal | Basic |
| G | Macroeconomic Only | Macro Only | |
| H | Out of Business | Negative Events | High Risk Events |
| I | Unable to confirm Designation | ||
| J | Unfavorable Bankruptcy | ||
| K | High Risk-Severe Risk | ||
| L | Self Reported Duns Support Record | ||
| N | Insolvency/Unable to pay debts Record is delisted | ||
| O | Record is delisted | ||
| P | Ceased Trading and Liquidation Process | ||
| R | Business Financial Embarrassment |
The D&B Rating can be used to quickly understand the size and overall credit level of target company. The rating criteria combinesmultiple key factors which can refect a business’s financial strength and credit capacity. The rating widely covers companies in theDun & Bradstreet data cloud, enabling easy comparison of financial and credit profles among companies, which helps you to reducethe risk of financial loss caused by partner's credit or operational issues.
The D&B Rating provides an indication of creditworthiness and consists of two parts, Financial Strength: an indication of firm size basedon emplovee size or financials, Risk indicator: an overal evaluation of creditworthiness based on information available such as tradepayment history, length of operation, employee numbers, and financials.
| Net Worth | Capital | From-(HK$) | To -(HK$) |
|---|---|---|---|
| 5A | 5AA | 300,000,000 | And Above |
| 4A | 4AA | 70,000.000 | 299,999,999 |
| 3A | 3AA | 10,000.000 | 69.999.999 |
| 2A | 2AA | 7.000.000 | 9.999.999 |
| 1A | 1AA | 6.000.000 | 6.999,999 |
| A | AA | 5.000.000 | 5.999,999 |
| B | BB | 4.000,000 | 4.999.999 |
| C | CC | 3.000,000 | 3.999.999 |
| D | DD | 2.000.000 | 2.999.999 |
| E | EE | 1.000,000 | 1.999.999 |
| F | FE | 500,000 | 999.999 |
| G | GG | 200,000 | 499,999 |
| H | HH | 0 | 199,999 |
| Other | Interpretation |
|---|---|
| N | Financial Strength is negative |
| O | Financial Strength is undisclosed |
| NB | New Business: Less than 24 months |
| FB | Foreign Branch |
| NQ | Out of Business |
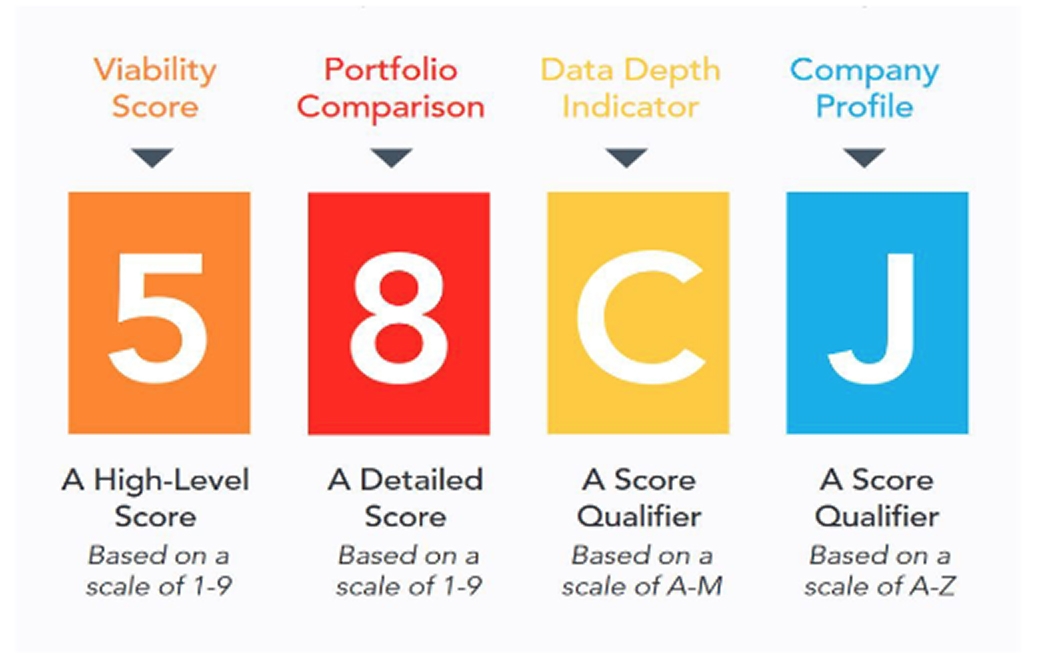
The D&B Viability Rating is a multi-dimensional rating that delivers a comprehensive assessment of a company’s future viability. It combines the deepest measures of risk to deliver a highly reliable rating that analyzes current and future health. The rating is available in United States and Canada.
The D&B Viability Rating comprises both predictive and descriptive components. Predictive components predict the likelihood that a company will go out of business, become inactive, or file for bankruptcy over the next 12 months. The descriptive components provide an indication of the amount of predictive data available to make a reliable risk assessment, as well as insight into the age and size of business.
A numeric rating from 1 to 9, where 1 represents the lowest probability of business failure and 9 the highest.
A numeric rating from 1 to 9, comparing the target company’ s likelihood of failure to similar businesses within the same industry sector, where 1 represents the lowest probability of business failure and 9 the highest.
A letter grade from A to M, where A indicates the greatest level of predictive data, such as financial statements, and G reflects a minimal level of data, such asfirmographics only. The indicators H – M are assigned to businesses with special risk circumstances such as bankruptcy, business deterioration, severe risk etc.
A letter grade from A to Z, examines how established a company is based on a combination of categories including financial data, trade payments, and demographics on the different categories within the profile"
Hong Kong Financial Stress Score is risk assessment tool specifically developed for the Hong Kong market. Based on extensive data analysis, this scientifically designed statistical model predicts the likelihood that a company will will, in the next 12 months, seek legal relief from its creditors or cease business operations without paying all its creditors in full.
To help evaluate risks objectively and consistently, Dun & Bradstreet combines a large amount of business information with expert analysis and statistical techniques to help determine the potential risk associated with a business. The Financial Stress Score provides risk insights in three formats: a raw numerical score, a score ranging from 1 to 10, an intuitive risk classification.
| Risk Class | Minimum Norm Score | Maximum Norm Score | Incidence of failure | Commentary |
|---|---|---|---|---|
| 1 | 1488 | 1890 | 0.11% | Far Below Average |
| 2 | 1459 | 1487 | 0.27% | Below Average |
| 3 | 1448 | 1458 | 0.37% | Average |
| 4 | 1427 | 1447 | 0.49% | Slightly Above average |
| 5 | 1001 | 1426 | 0.89% | 2.5 Times above Average |
The D&B Delinquency Score predicts the likelihood that a company will pay in a severely delinquent manner (91+ days past term) over the next 12 months, seek legal relief from creditors, or cease operations without paying all creditors in full over the next 12 months.
The D&B Delinquency Score is presented in three formats: Raw Score (101–670): A numeric score where 101 indicates the highest probability of severe delinquency, and 670 the lowest. The raw score allows for precise segmentation and supports automated decision-making; Percentile Score (1–100): A percentile rank where 1 represents the highest risk of severe delinquency and 100 the lowest. This score ranks companies across the Dun & Bradstreet Data Cloud from highest to lowest risk, providing clear visibility of a target company's relative standing; Risk Class (1–5): A simplified risk banding, where 1 indicates the lowest risk of severe delinquency and 5 the highest. This class system enables fast grouping of new or existing business partners, allowing you to align them with appropriate credit policies.
For companies that extend trade credit, the D&B Delinquency Score helps assess the potential credit risk of a business partner and offers valuable guidance for setting credit limits, payment terms, and prepayment requirements.
| Risk level range | HIGH | MODERATE HIGH | MODERATE | LOW MODERATE | LOW |
|---|---|---|---|---|---|
|
Raw Score (101 - highest risk; 670 - lowest risk) |
101-452 | 453-480 | 481-529 | 530-579 | 580-670 |
|
Delinquency Socre (1 - highest risk; 100 - lowest risk) |
1-10 | 11-30 | 31-70 | 71-90 | 91-100 |
|
Class (1 - lowest risk; 5 - highest risk) |
5 | 4 | 3 | 2 | 1 |
| Probablity of Delinquency of the Risk Class | 53.1% | 9.4% | 5.8% | 2.5% | 1.1% |
Dun & Bradstreet delivers an Overall Business Risk that uses the best available scores, ratings, and indices to provide a high-level assessment for each entity. The overarching Low- to High-Risk Levels are based on the combination of individual risk levels for scores, ratings, and indices that have been assessed for the specific company. While each market globally will have their own risk scores and ratings, the Overall Business Risk uses data that is available locally to create a globally consistent view that can be used to compare businesses in different countries to one another.
| Risk level range | HIGH | MODERATE HIGH | MODERATE | LOW MODERATE | LOW |
|---|
Dun & Bradstreet believes…
Overall assessment of the organization: Stable condition
Based on failure risk: High likelihood of continued operations
According to payment capability and actual payment behavior from trade credit data: Low creditworthiness
D&B Maximum Credit Recommendation (MCR) helps businesses understand an indicative level of commercial credit that may be considered for customers and business partners, supporting credit risk assessment and effective credit management.
MCR is generated based on Dun & Bradstreet’s available business information and risk insights and is based on monthly payment terms. Coverage and availability may vary by country or region due to differences in data availability and market conditions.
MCR represents the total value of goods and/or services that may be outstanding with an organisation at any point in time. It is provided for reference purposes only and does not take into account specific trading terms, contractual arrangements, or agreed credit limits between you and the subject entity. Users should apply their own credit policies and appropriate credit management controls when determining final credit limits.
D&B Maximum Credit Recommendation
The D&B Supplier Evaluation Risk (SER) leverages data from the Dun & Bradstreet Data Cloud to predict the likelihood that a supplier will cease operations or become inactive over the next 12 months. It use scientifically validated statistical models that apply probability-based risk factors, taking into account varying economic conditions across different markets, to produce an objective risk assessment of the target supplier.
The D&B Supplier Evaluation Risk is an alphanumeric rating (e.g., 8C), where the numerical part indicates the overall risk level,the letter reflects the depth used to generate the rating. The numeric score reflects the target company’ s position relative to all businesses in Dun & Bradstreet’s global database, categorized into nine risk levels — with 1 indicating the lowest risk and 9 the highest.
| Predictive | Descriptive |
|---|---|
| SER Rating (1-9 Scale) | Depth of data D&B has on the buisness (A-M classes) |
| 8 | C |
| Risk level range | HIGH | MODERATE | LOW | ||||||
|---|---|---|---|---|---|---|---|---|---|
| SER | 9 | 8 | 7 | 6 | 5 | 4 | 3 | 2 | 1 |
| Out of Business Rate | >5.70% | 5.69% | 3.83% | 2.88% | 2.05% | 1.37% | 0.54% | 0.25% | 0.12% |
| Depth of Data | Description | Level of lnsight |
|---|---|---|
| A | Rich Firmographics,Extensive commercialtrading activity,and ComprehensiveFinancial attributes | Robust Predictions |
| B | Rich Firmographics,Extensive commercialtradingactivity,and/or Basic Financialattributes | |
| C | Rich Firmographics, Extensive commercial tradingactivity,and no Financialattributes | Decision Support |
| D | Rich Firmographics, Partial commercialtradingactivity,and no Financialattributes | Directional |
| E | Rich Firmographics, Sparse commercialtradingactivity,andno Financialattributes | |
| F | Basic Firmographics, Trace commercialtradingactivity andno Financials attributes | Basic |
| G | Basic Firmographics andno FinancialAttributes | |
| H | Out of Business | |
| I | Unable to Confirm Designation | |
| J | Bankruptcy | |
| K | High Risk - Severe Risk | |
| L | Self Reported Duns Support Record | |
| M | Business Deterioration - Severe Risk | |
The D&B Supplier Stability Indicator (SSI) is a quantitative score developed based on Dun & Bradstreet’s B2B supply chain data, designed to predicts the likelihood that a supplier will file for bankruptcy, cease operations, or become inactive over the next 3 months. his globally aligned indicator enables clients to evaluate their suppliers using a consistent measurement framework across different markets. The D&B Supplier Stability Indicator incorporates a wide range of data inputs — including trade payment behavior, operational activities, financial statements, and macroeconomic factors — toassess and forecast short-term supplier risk.
The score is expressed as an alphanumeric rating (for example: 8C), where the numeric part indicates the overall risk level, ranking the target company relative to all businesses in Dun & Bradstreet’s global database, and the scale is divided into 9 levels, with 1 representing the lowest risk and 9 representing the highest risk.The letter part reflects the depth and completeness of the data used to calculate the rating.
| Predictive | Descriptive |
|---|---|
| SSI Rating (1-9 Scale) | Depth of data D&B has on the buisness (A-R classes) |
| 8 | C |
| Risk level range | HIGH | MODERATE | LOW | ||||||
|---|---|---|---|---|---|---|---|---|---|
| SSI | 9 | 8 | 7 | 6 | 5 | 4 | 3 | 2 | 1 |
| Out of Business Rate | 14.91% | 9.72% | 7.17% | 5.26% | 4.21% | 3.43% | 2.99% | 2.70% | 2.50% |
| Depth of Data | Description | Level of lnsight |
|---|---|---|
| A | Financials with trade | Robust Predictions |
| B | Financials only | |
| C | Withont financials, but with rich trade only with payment trends in the recent months | |
| D | Without financials. but with historical trade only | Directional |
| E | Full fimmographics and business activity signals | |
| F | Full firmographics only | Basic |
| G | Basic firnographics, business activity signals, or macroeconomic attributes | |
| H | Out of business | High Risk Event |
| I | Unable to confirm | |
| J | Unfavorable bankuptcy | |
| K | High Risk - Severe Risk | |
| L | Self-reported Duns Support | |
| M | Business Deterioration -Severe Risk | |
| N | Insolvency/Unable to pay debts | |
| O | Record is delisted | |
| P | Ceased trading and liquidation process | |
| Q | Business financial embarrassment |
D&B PAYDEX Score is designed to evaluate a company’s payment performance, serving as a quantitative indicator of its payment habits and credit behavior using DUNTrade data. The D&B PAYDEX Score is a dollar-weighted indicator intended to reflect a business’s past payment performance. Companies receive a score between 1 and 100, where a higher number represents a greater likelihood that a business will pay its debts on time. This proprietary score is calculated based upon Trade Experiences, which are records of payment experiences submitted to Dun & Bradstreet by suppliers and vendors, subject to Dun & Bradstreet's review, verification, and approval process. These records can include overdue debts and bills that have been sent to collections, or on-time and early payments. Dun & Bradstreet can consider Trade Experiences from around 15,000 individual business partners globally when determining your D&B PAYDEX Score.
Learn More about DUNTrade Program
D&B PAYDEX Score helps clients understand the payment habits of potential customers quickly and intuitively. For small transactions, it enables quick credit decisions. It also helps develop and optimize collection plans based on the customer's overdue payment history. Additionally, it allows for easy comparison of the payment habits of the target company with the overall industry, providing a basis for formulating credit policies.
| D&B PAYDEX Score | Risk level range | |
|---|---|---|
| 100 | 30 Days Before Terms (Anticipate) | 70-100 US MARKET NORM |
| 90 | 20 Days Before Terms (Discount) | |
| 80 | 0 Days, On Terms (Prompt) | |
| 70 | 15 Days Beyond Terms | |
| 60 | 22 Days Beyond Terms | 60-69 BELOW US MARKET NORM |
| 50 | 22 Days Beyond Terms | 40-59 CONCERNING PAYMENT HISTORY |
| 40 | 60 Days Beyond Terms | |
| 30 | 90 Days Beyond Terms | 21-39 MODERATELY POOR PAYMENT PERFORMANCE |
| 20 | 1200 Days Beyond Terms | |
| UN | Unavailable | 0-20 POOR PAYMENT PERFORMANCE |
D&B Financial Benchmark Score reflect the financial condition of the target company and its industry peers. These indicators help companies to gain multi-dimensional insights into the financial status of the target enterprise and identify potential financial risks, understand the financial performance of the target company compared to industry standards within its segment, enrich financial data perspectives to enhance the accuracy of overall risk assessments of the target enterprise.
D&B Financial Benchmark Score evaluates four key dimensions: Solvency, Operating Efficiency, Profitability, and Growth Potential. Each dimension is analyzed through the following eight financial indicators: debt-to-Asset ratio, owners' equity growth rate, total asset turnover, main business revenue ratio, net profit margin, return on equity, revenue growth rate, net profit growth rate.
| Financial Capability | Financial Indicators | Financial Performance |
|---|---|---|
| Solvency | Debt to asset ratio% | D |
| Owner's eguity growth rate% | A | |
| Operating | Total assets turnover | A |
| Revenue from main business% | A | |
| Profitability | Net profit margin% | C |
| Return on equity% | A | |
| Solvency | Operating income growth rate % | A |
| Net profit growth rate% | C |
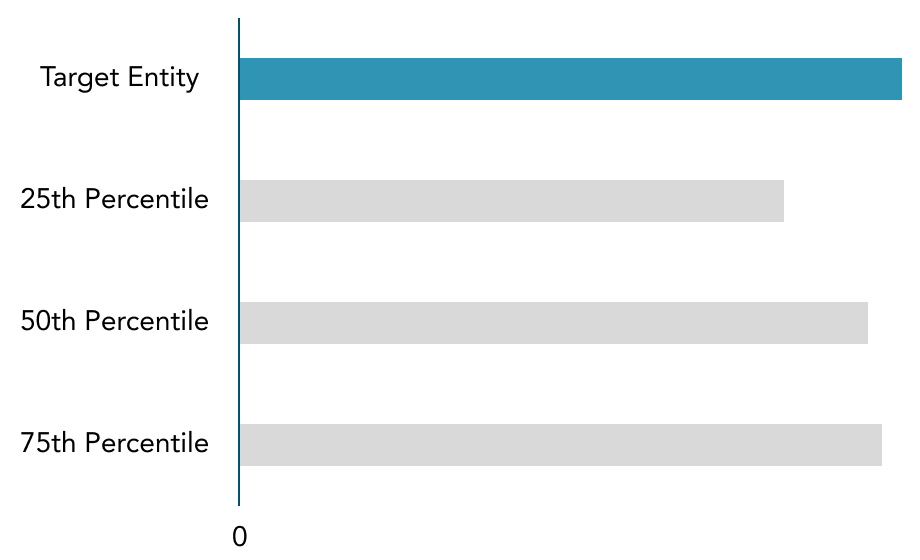
The debt to asset ratio is the percentage of total liabilities divided by total assets. The higher ratio reflects the companyhas higher debt and faces more pressure to service its debts.
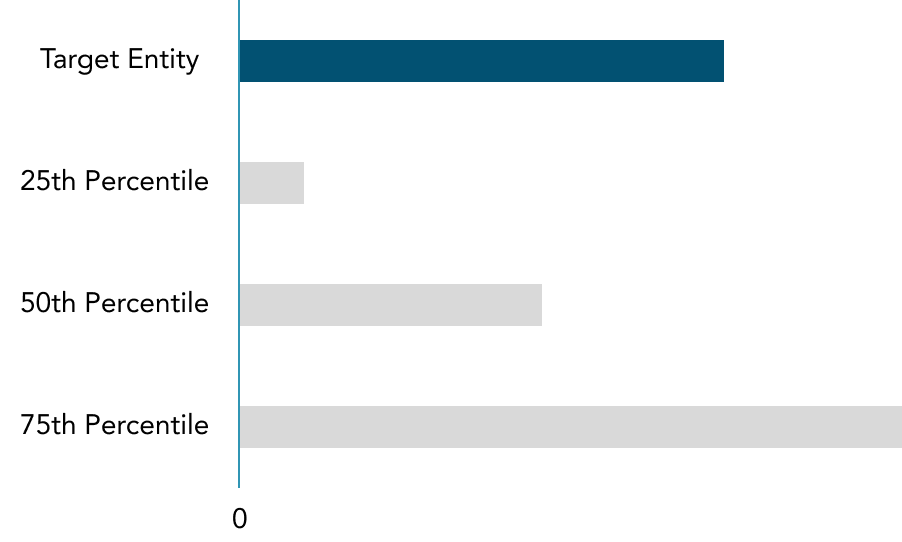
The higher rate reflects the company has faster growth of owner's equity (net worth), and the stronger capital strength.